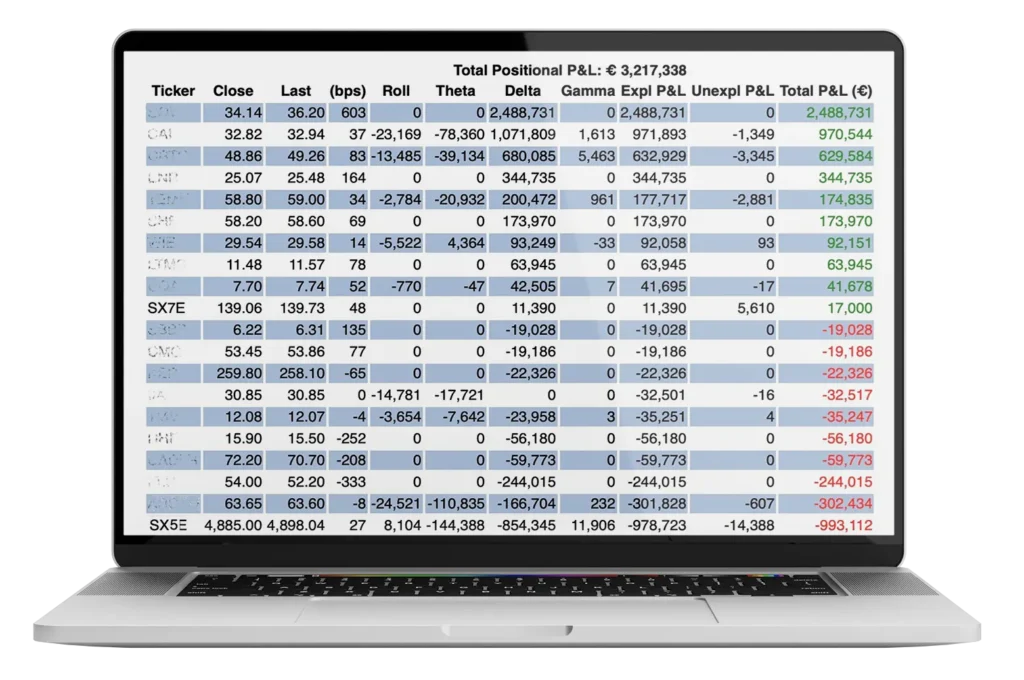
Real time state of the art profit and loss for your fund. This includes explained PnL from 1st and 2nd order risk factor as well as time value and curve / vol surface rolls. This is risk based explanation is compared to ticking live data (if available) or full revaluation of non-linear instruments. This tool gives you a clear summary of which risk factors and changes in the underlying real time market data are contributing to the change in value of your investments.
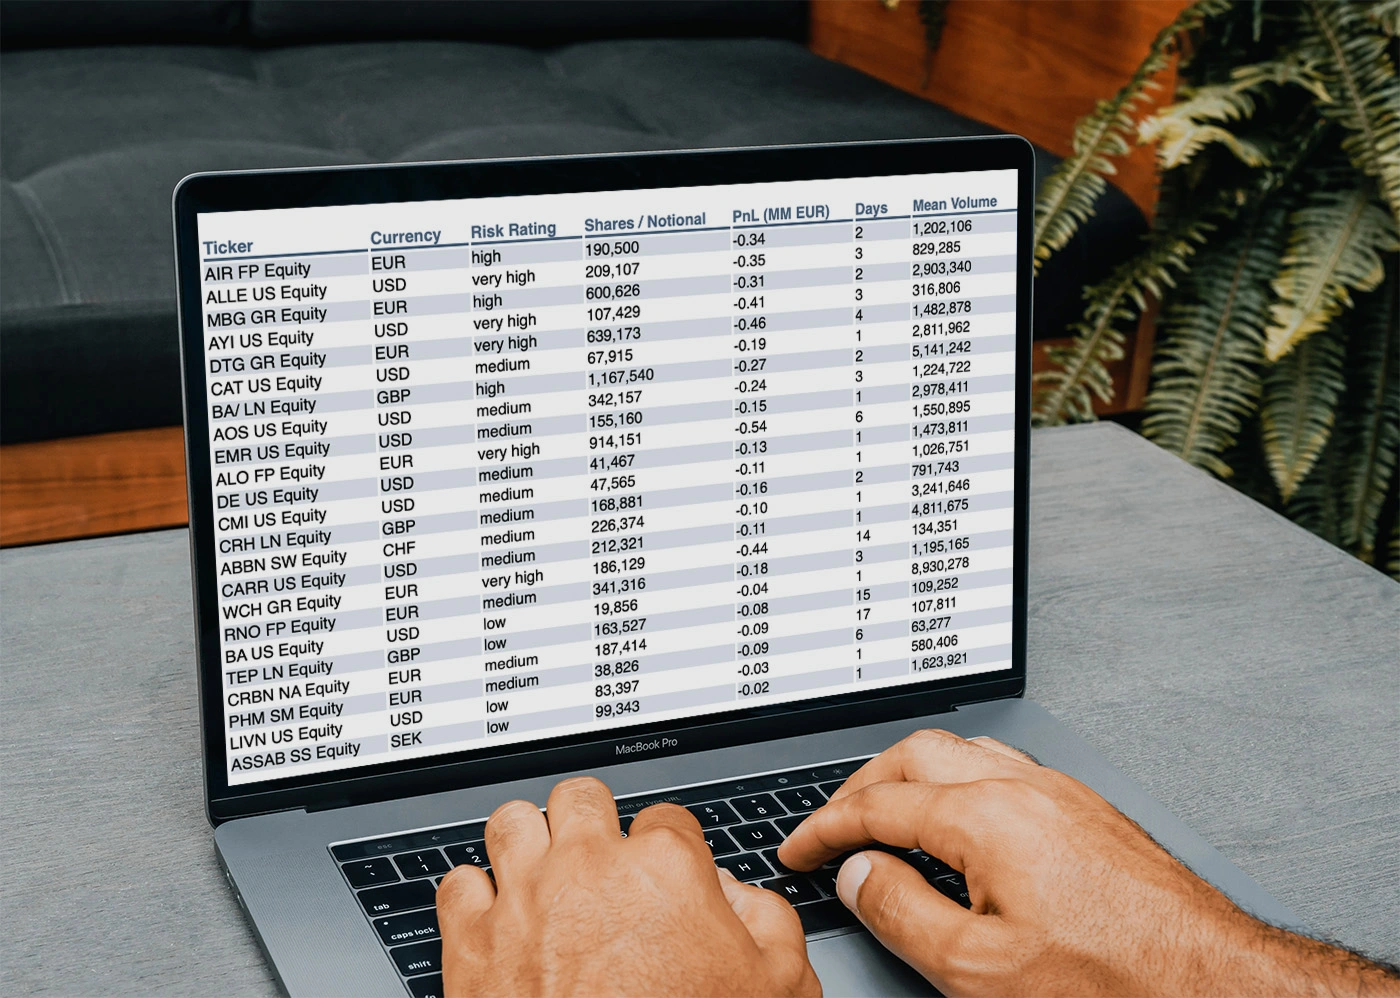
The exposure and liquidity model and resulting report gives you an idea of the liquidity risk implicit in your positions. The underlying model is calibrated to past trading behaviour and available liquidity resulting in a liquidation cost of each position. The model also provides a combined loss function should you need to trade out of more than one position at the same time.
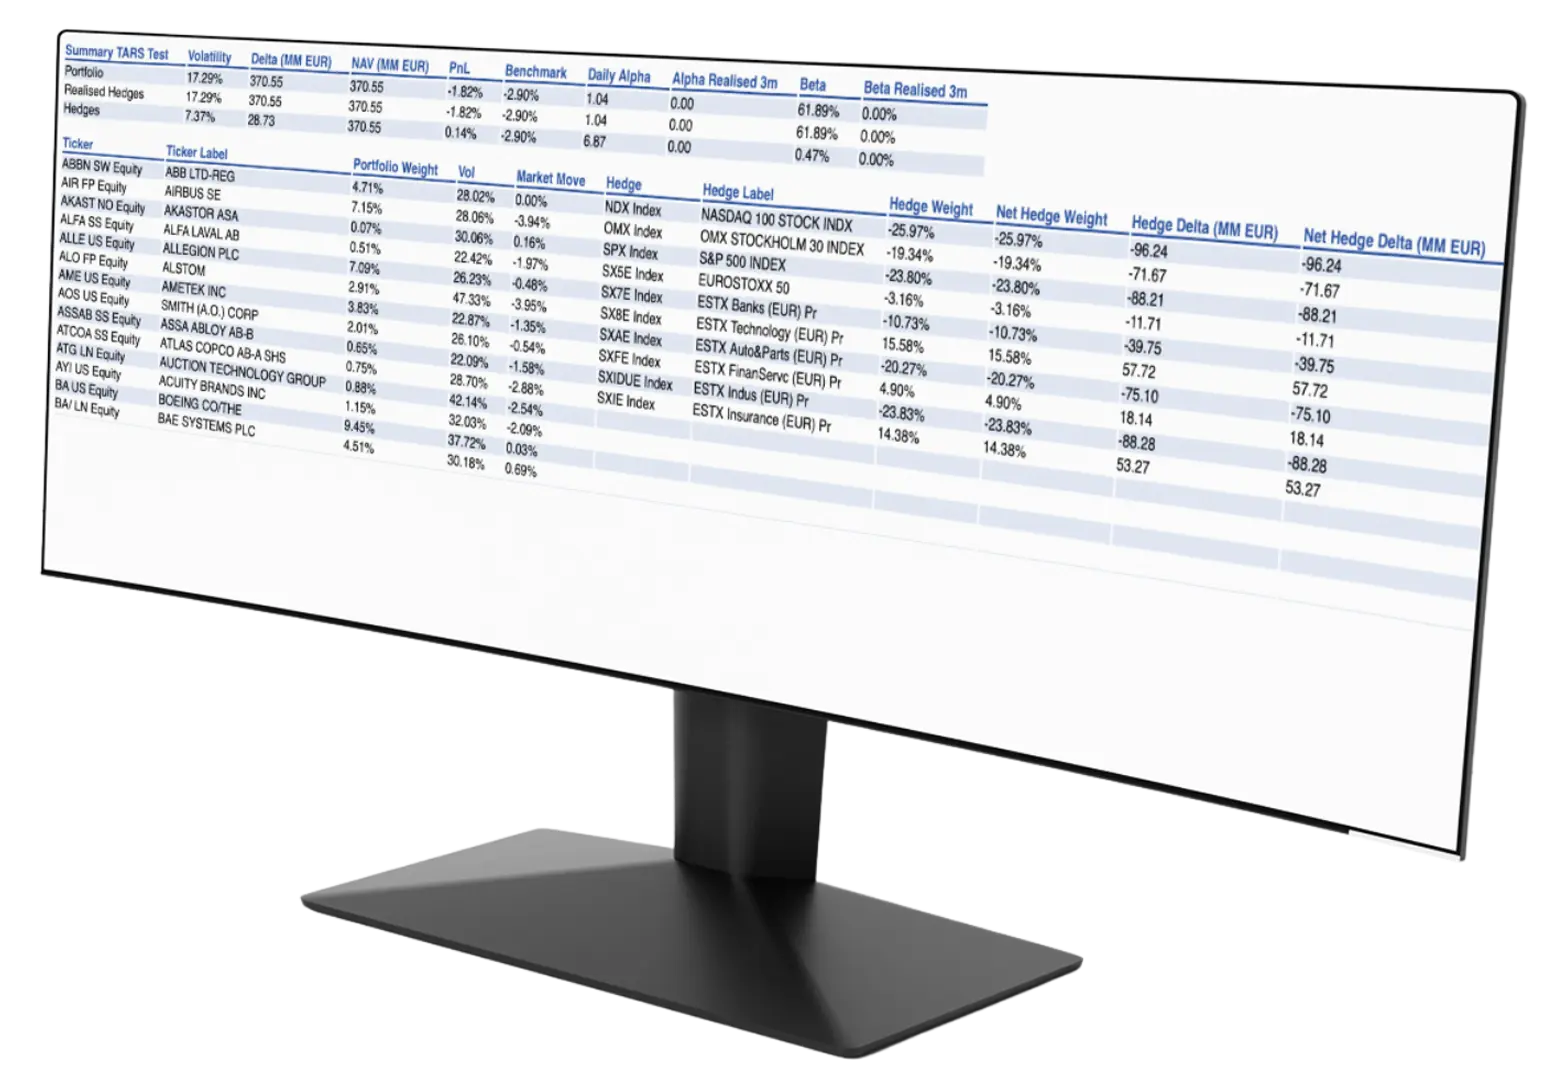
A proprietary factor model to find the factors structure implicit in your portfolio positions. The model is highly customizable in computing factor exposure to any level of detail as well as in various market scenarios (for example large downward market shock). All factors can be hedged using combinations of market futures and details of the factor hedge are available including hedging deltas volatilities implied moves and resulting changes in portfolio volatility for the outright and hedged portfolio.
Comparisons of the past and present performance to a freely choose able benchmark portfolio in terms of alpha and beta can be computed.
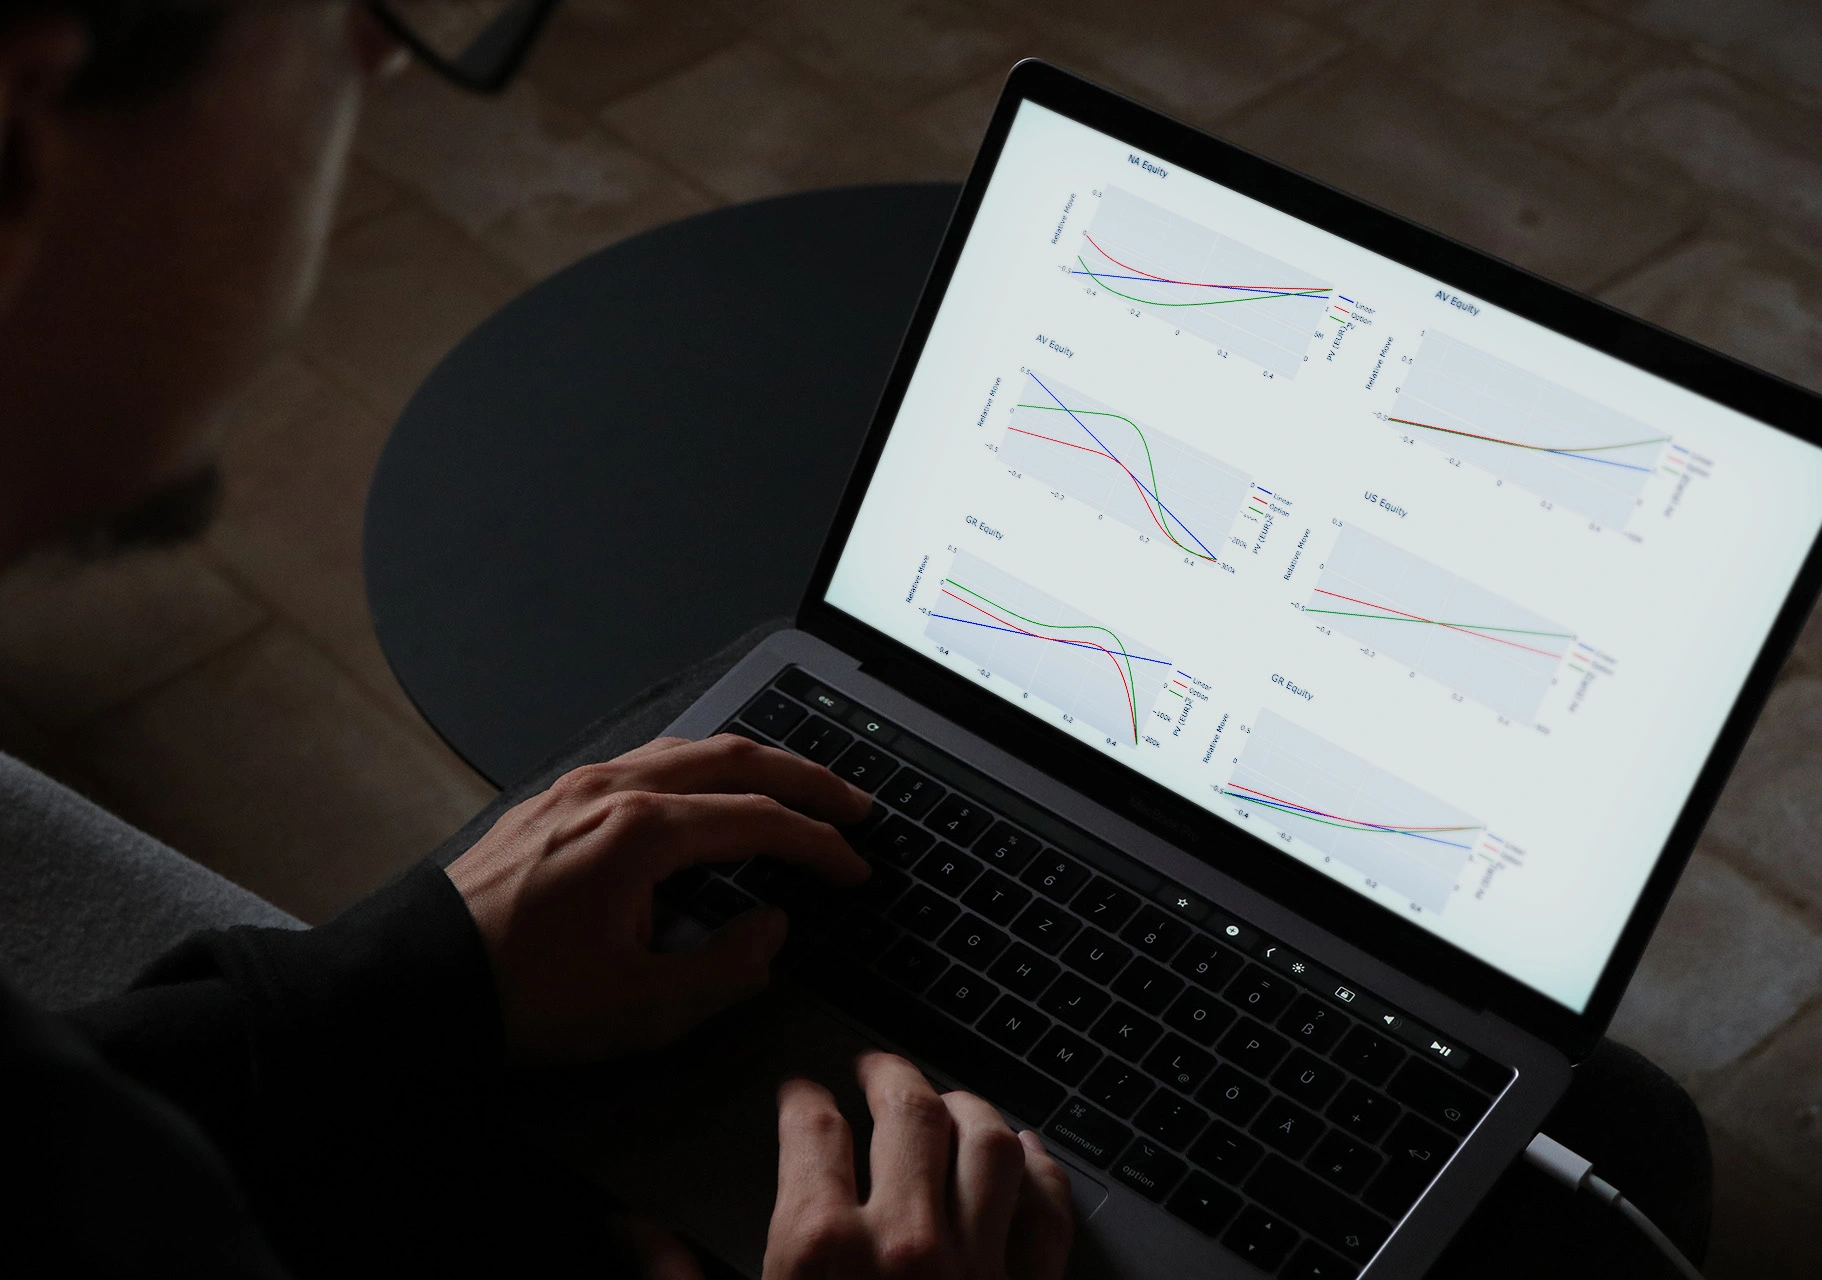
For non-linear positions in the portfolio this report gives and overview of the relative and absolute performance of the option positions in the portfolio with respect to the market move of the underlying security. The performance is compared to the performance of the linear position calibrated to match the combined delta position of the option portfolio. This report is intended to give the trader a better view on the possible outcomes of the option strategy as well as alerting risk management to adverse scenarios inherent in the portfolio.

A powerful and easy to use scripting environment is available, based on state-of-the-art industry standards of risk and valuation systems. This includes trade and portfolio creation, risk runs and valuations as well as functions to script scenarios, run models and format output. Combined with APIs to common PMS systems as well as Bloomberg and a large internal data base, we can customize existing reports as well as write new ones cost effectively. Reporting is available on demand at a Web URL or alternatively can be sent by email.
A scripted batch API is also available, with intra job dependencies to schedule overnight runs as well as regular intraday reports and processes. These can be integrated into your current setup using existing API connections to your systems.